Quality analytics depends on an understanding of the business problem to be analyzed and an experienced, knowledgeable team of data pros with the right tools and techniques to conduct the analysis. But the single most important ingredient is quality data. Essentially, data quality comes down to three factors: input data, methodology in creating these data and quality control.
Understanding input data
When it comes to input data, the old saying applies: garbage in, garbage out. High-quality input data are fundamental to producing reliable models and data sets. Regardless of how good your models are, if the input data used to build and implement them are bad—incomplete, outdated, biased or otherwise inaccurate—the resulting predictions or data sets have little chance of being reliable.
Now, data are never perfect, which you don’t often hear a data provider admit. But the reality is data are subject to how, where, when and from whom they were captured. Any of these aspects can be a source of bias or error. So it is imperative to understand the pedigree of input data and determine how “clean” the data are before embarking on any analytics effort.
No matter how “up-to-date,” data always present a snapshot in time, and that time is, by necessity, in the past. Knowing when (recency and frequency) and how (process) the data were collected helps in determining the degree of data “cleanliness” and also assists researchers choose the right methodology and the types of analysis that may or may not be appropriate.
The recency of input data determines how well they reflect the current state of affairs. Data that are five years old are bound to be less representative of the present than data that are five minutes old. Further, the frequency of data collection is also important because this influences the types of models that a researcher can use and how often those models can be calibrated and their predictions tested. As researchers and marketers, we have to use history to predict the future. There is no changing this fact. But it is our job to determine how well historical data reflect the present or predict the future—and make adjustments where necessary.
The second critical aspect of input data is knowing how the data were collected. The data collection process is often flawed, which leads to errors, outliers and biases in the resulting data. For example, data on purchase behaviour collected via a survey will be quite different than data collected at the point of sale. What people say they did is typically quite different from what they actually did.
Applying the right methodology
 “Methodology” here refers to the techniques Environics Analytics (EA) uses to build our data products, such as DemoStats and DaytimePop. These techniques range from simple rule-based algorithms to machine learning methods. In large part, the type, amount, reliability and recency of data available affect the method we use. The methods and models focussed on here relate to those used for creating quality data sets.
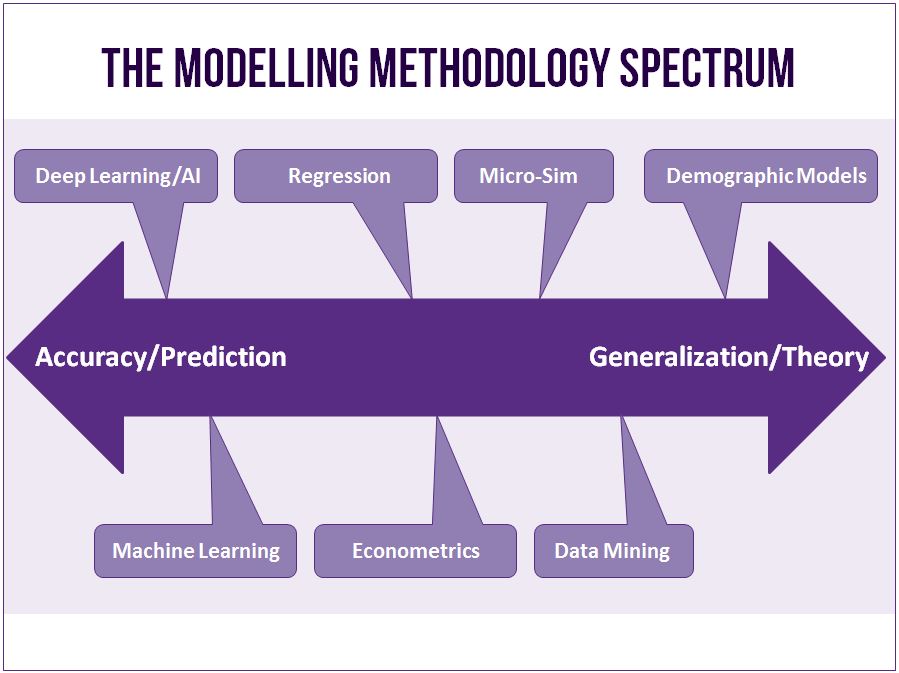
It is helpful to think about methodology as a spectrum, with model accuracy on one end and model generalization at the other. While there is not a direct trade-off between accuracy and generalization, modelling techniques tend to start at one end of the spectrum. And through model training, calibration and testing, an analyst can work models toward the other end of the spectrum. The best models have high levels of accuracy and generalization. The Modelling Methodology Spectrum illustrates where along the accuracy-generalization continuum various modelling techniques starts.
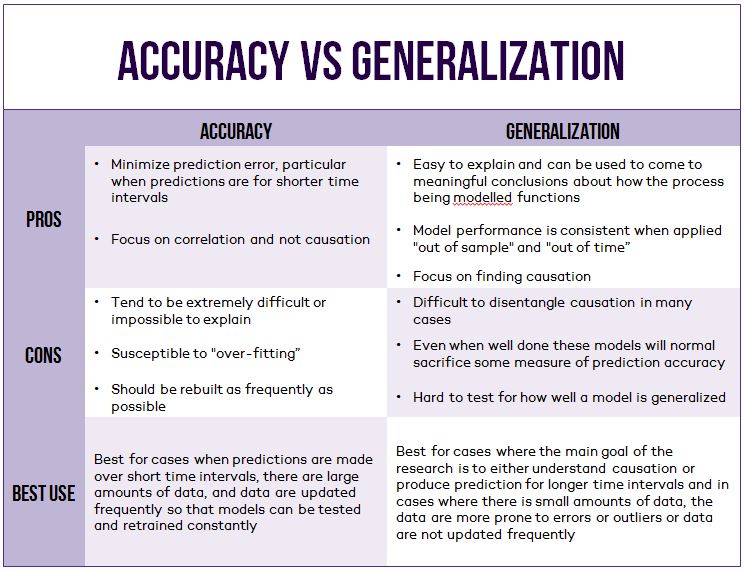
When deciding which techniques to use to build a standard dataset, analysts should compare the advantages and disadvantages of techniques focused on accuracy versus those focused on generalization (as illustrated in the Accuracy vs. Generalization table).
At EA, we work hard to balance prediction accuracy and model generalization when building our datasets. We test different modelling frameworks for nearly every type of data set we develop, and for every level of geography and collection of variables we produce. Where the data are available at a high frequency and are reliable, we apply techniques that are more focused on the accuracy of prediction. Where data are less frequent and less reliable or we have to predict far into the future, we focus on building models that generalize well and do our best capture causation rather than correlation.
When it comes to creating analytical methods and models for dataset creation, one size does not fit all. Modelling techniques are designed to solve particular types of problems with specific types of data based on a set of assumptions. It is possible to adapt most modelling techniques to a wide range of applications and input data types, within limits. When choosing the right methodology, it is very important to be aware of the limitations of different modelling techniques, as well as the limitations imposed by the input data.
Ensuring quality control
 Quality control or assurance for data boils down to two key elements: comparisons against authoritative data sources and judgment. In cases where authoritative data are available, it is straightforward to calibrate some models, test their results and assess the prediction accuracy. This is a highly valuable step in any modelling exercise. In essence it is an expansion of cross-validation techniques used in statistics and machine learning. All good modellers build models, make predictions, measure the accuracy of those predictions and then refine their models as a result.
The second element, judgment, is much more challenging and tends to be somewhat subjective. In our business, there can be a relatively long time period between when we make our predictions and when authoritative data are available to validate those predictions. Fundamentally, when you produce a prediction for 10 years into the future, how can that be quality controlled? Use your best judgment and wait 10 years to see how you did.
At EA, we spend just as much time doing quality control as we do building models. We use our experience, domain knowledge and best judgment to test the reliability of our data and models. One way we do that is by building competing approaches that we can use to test our core methodologies against. This process typically leads to some very important questions: How many predictions are comparable? Why and where are predictions different? Which prediction is more believable? Are there systematic differences between the two predictions that we can leverage? Also, when new authoritative data become available, we compare the various methods that we have used to determine if it is necessary to change the core methodology.
QA is an integral part of building datasets and ensuring their quality and it requires continually improving methodologies and datasets. It also means that researchers cannot become complacent. Without a thorough QA process it is easy for researchers to fall into the trap of using the same methodologies and data sources simply because they were used in the past. And the last thing any research business wants is complacent researchers.
There are many challenges to creating quality data. Without exception, no data are perfect and determining how clean the input data are is vital. When it comes to methodology, one size does not fit all and there are trade-offs that must be intelligently considered based on the nature of the data and how the data are going to be used. Finally, creating quality data requires that models be tested and assessed as frequently as possible and then adjusted based on that assessment. The quality of your business decisions rests on the quality of the analysis that drives your decisions, and the quality of the analysis rests on the quality of the data. In the marketing analytics business, we can never forget that fundamental relationship.
This article originally appeared in the January 2017 issue of Direct Marketing.
Related Posts

No Comment